Nearly all small businesses we know want better results from their marketing. But the problem is this: A lot of those businesses are only looking at one metric: revenue or sales. And we certainly understand that – that’s the one metric that really matters. The issue is that a lack of revenue or sales doesn’t really tell you anything about your marketing performance other than the fact that it’s not working. It certainly doesn’t tell you why you’re not getting additional sales.
That’s why it’s important to look at other metrics too – what are known as key performance indicators (KPIs). KPIs basically tell you how you’re tracking toward a particular end goal such as revenue. Better yet, they can provide evidence of where you may not be performing as well from a marketing standpoint.
Let’s take a look at a basic marketing funnel to show you what we mean, at least on a macro level.
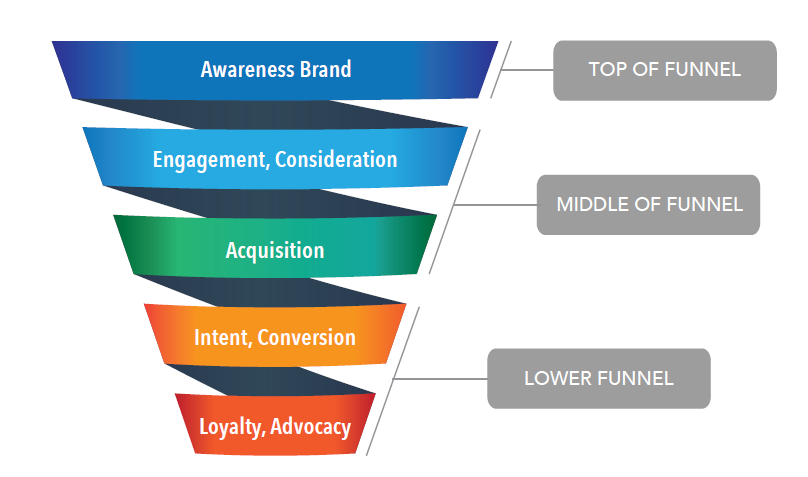
So, let’s start at the top – or what’s known as the top-of-the-funnel in marketing. At this stage of the buyer journey, what you’re trying to do is really get the maximum number of audience touches you can to relevant audiences. These are what’s known as impressions. Impressions (people seeing your brand as well as your product/service) are critical in order for them to take the next step in the process – to learn more about you. (Because they have to become aware of you first!) Measuring this is key to a lot of your marketing as you may not be getting in front of enough people to start with.
Second, let’s take a look at that middle-of-the-funnel stage – where customers engage with you and/or you may add them to your email list. So, for this stage, maybe you want to look at KPIs such as website visits/visitors or email acquisition through a newsletter, a piece of content, or a contact form. Maybe you also look at pages viewed or time spent on the site through, say, Google Analytics. Those are all great indicators as to whether you’re getting people interested in who you are and what you offer.
Third, let’s look at the lower funnel – generally what we call the decision/conversion phase, as well as any post-purchase marketing activities you have in place. For example, for an online retailer, this might be the number of individuals who added something to a cart and/or eventually made a purchase through your store. It could also involve the number of reviews you received after an email outreach campaign. For a B2B company, it might be the number of closed sales and/or follow-up purchases.
Now, that’s just on the macro level.
Taking a Look at KPIs By Channel (Two Examples)
If you think about it, the marketing channels you use and the tactics you employ are all focused on moving your customers further down the buyer journey toward purchase. So, it’s pretty important to also understand how we’ll you’re performing in different channels as well.
This is where marketing gets very hard – also it becomes very specialized with a particular set of skills needed for each channel to diagnose what’s going on and how to fix it. It can be a time-consuming process as well. Let’s take a couple of examples in different channels, email marketing and, say, paid search, two very common small business marketing activities. We’ll outline both how to diagnose what’s going as well as steps to take if you’re falling below an average benchmark for each.
Email Marketing. Here are some common KPIs to track with benchmarks:
- Open rate. The common benchmark for email open rates is about 20 percent. In other words, 20 percent of all your emails should generally be opened. If you’re falling significantly below this average, it could indicate that you’re not getting your audience interested in what you’re sending. (And if they don’t open it, they can’t interact with your email!)
- How to Address Issues with This KPI: There are only two ways to really improve your open rates. First, adjust the sender name. (Indeed, people look at who the email is from first and foremost.) Sometimes, making it come from a human being will help. Second, you can adjust the subject line and/or preview text. Can you create more urgency here or try a different approach (humor, use a pun, etc.)? Anything that will get the audience’s attention and make them click on it.
- Click-through rate. You can measure this in two ways: The click-to-open rate or the overall send-to-click-through rate. For our purposes, let’s use the click-to-open rate, which is the ratio of the number of clicks compared to the number of email opens. The rate will vary wildly by email type and industry. Generally, though, the rate is about 14 percent for mobile devices and 18 percent for desktop.
- How to Address Issues with This KPI: If individuals are opening the email, but not clicking through, it’s an indication that the body of your email is not compelling. A few things that you can do here:
- Improve the visual weight of the email. We’ve talked a lot in these pages about designing for visual weight, making sure key elements are highlighted and not packed together in one screen. This is especially important on mobile devices.
- Make sure there’s a clear call to action. Oftentimes, emails can bury the call to action. Using a single button – or making it stand out can also help improve click-through rates.
- Add social media buttons. One of the areas that email recipients will often click on are social icons, which go to your business pages of the different social platforms. Make sure to include these as it’s another way for your to engage with you.
- Conversion rate. Your conversion rate will vary by email type (generally it’s anywhere from 1 percent for, say, a newsletter, to 5 percent for an abandoned cart email). It also depends greatly on the open rate and the click through rate.
- How to Address Issues with This KPI: If individuals are opening and clicking through at a good rate, then it may be that you have to improve your landing page. If you think about it, sending your audiences from email to a bad landing page experience will almost guarantee that you won’t get the conversions you seek. Similar to the email body, take a look at a few factors:
- Improve the visual weight. Designing a landing page is all about making it easy for the reader to navigate (as it is with the email body).
- Make sure there’s a clear call to action. Like the email body above, make the call to action on the page stand out, and make sure it’s repeated throughout the landing page for emphasis. In other words, identify what you want your visitor to do next.
- Add social proof. To get more conversions, you may want to boost the social proof on any landing page. What we mean by that is adding testimonials, reviews or anything that helps others to know that customers have used your product/services/company and had a great experience.
- Unsubscribe rate. The average unsubscribe rate, again, varies by industry and by email type, but it’s roughly .25%. High unsubscribe rates can mean two things: 1. Your emails aren’t relevant to the audience interest or; 2. You’re sending too much to people or individuals never signed up for the emails in the first place.
- How to Address Issues with This KPI: If individuals are unsubscribing at an alarming rate, you might want to throttle back on the number of emails you’re sending. The other thing: You’ll want to make sure to look at ways you can acquire more people to your email list – so you can keep your subscriber levels high – or do some sort of list hygiene cleanup (especially for B2B emails).
- How to Address Issues with This KPI: If individuals are opening and clicking through at a good rate, then it may be that you have to improve your landing page. If you think about it, sending your audiences from email to a bad landing page experience will almost guarantee that you won’t get the conversions you seek. Similar to the email body, take a look at a few factors:
- How to Address Issues with This KPI: If individuals are opening the email, but not clicking through, it’s an indication that the body of your email is not compelling. A few things that you can do here:
- Open rate. The common benchmark for email open rates is about 20 percent. In other words, 20 percent of all your emails should generally be opened. If you’re falling significantly below this average, it could indicate that you’re not getting your audience interested in what you’re sending. (And if they don’t open it, they can’t interact with your email!)
Now, let’s take a look at KPIs in another channel, paid search.
Paid Search Advertising. Here are some common KPIs to consider in this channel.
- Total impressions. The goal of any advertising is to make sure audiences are seeing your brand and/or products and services. There’s no general benchmark for total impressions as it’s going to depend on the keyword volume and the relevancy of your ad for that group of keywords. That said, if you’re failing to get a significant number of impressions, you might try the following:
- How to Address Issues with This KPI: Take a look at other potential keywords that are relevant to your business that could have more volume. Use Google’s free Keyword Planner or have your agency take a look at it on your behalf.
- Impression share. One of the tricky things with paid search in Google is to make sure that, of the available impressions that your ad can be shown for particular keywords, your ad is getting shown as much as possible. If your impression share is low, it’s generally indicative of two things: your budget or your ad quality/relevance.
- How to Address Issues with This KPI: If your impression share is low, Google will tell you why. If it’s due to budget, you may want to consider increasing your advertising spend. If you don’t, you likely won’t be getting enough impressions to generate any meaningful conversions. If it’s due to ad quality, there are a few things you can do, including improving your ad headlines to be more relevant to the keywords you’re bidding on, as well as improving your landing page (the latter is often the most common issue in that your landing page may not be specific enough for the terms being searched.)
- Click-thru rate. Much will depend on the industry here, but the average click-through rate for a paid search ad will be anywhere from 2 percent to 5 percent. If you’re trending anywhere below that, it can be any number of things, including your ad copy, your ad quality (which includes your landing page relevance), keywords you’re bidding on, and more.
- How to Address Issues with This KPI: If your click-through rate is low, we generally start looking first at your ad copy. Typically, the issue here is that your copy isn’t strong enough to get people to your target landing page. In those cases, creating a sense of urgency helps, perhaps offering a discount for those who see the ad, or creating headline copy in particular that gets your audiences interested. The second thing to consider is the keywords you are buying. It might be those keywords aren’t so relevant to your products/services. Adding negative keywords can help here (making sure you don’t show up for irrelevant terms).
- Conversion rate. When it comes to Google Ads, most small businesses we know want one thing: Conversions. That either comes in the form of purchases (if it’s a B2C retailer, for example) or the quality/quantity of leads generated.
- How to Address Issues with This KPI: If you’re getting a strong click-through rate on relevant terms, it may be your ad landing page that needs to be improved. We often see this issue. In the link above, we outline six key elements to consider when it comes to ad landing pages. One other thing: It might also be the way you want customers to interact with you and/or convert. In a mobile-first world, it’s becoming increasingly important for companies using paid Google search ads to include a phone number. Either on the ad itself (using an extension) or prominently displayed on the landing page. The bottom line: Make it easy for customers to connect with you!
- Total impressions. The goal of any advertising is to make sure audiences are seeing your brand and/or products and services. There’s no general benchmark for total impressions as it’s going to depend on the keyword volume and the relevancy of your ad for that group of keywords. That said, if you’re failing to get a significant number of impressions, you might try the following:
Conclusion
Those are just a couple of examples of KPIs that may be important for you to track. If you think about it, every channel has its own set of KPIs, and depending on your business, you’ll want to dig into the details. This is a lot of what makes marketing really hard in the modern age. But it’s also where you can gain a competitive advantage if you pay close attention to this versus those businesses that are also marketing to the same customers. If you need help, that’s why we’re here at Marketing Nice Guys. Contact us today for a free consultation and we’ll be happy to discuss your marketing challenges and how we can help solve them.